
Page 6 - March-April2020 Vol37 No7
P. 6
GERMANTOWN By Trevor A. Cropp, P.E.
Stormwater Master Plan in Action
As cities grow, population is not never previously had issues. The City was in the CIP, validate the necessity of a
the only statistic that changes. Local aware of the potential issues, and in 2016 stormwater strategy for the City’s growth,
governments are tasked to maintain a decided to establish a plan to handle these and respond to emergent needs as they
variety of assets, from roadway systems development trends and implement a arise.
to natural resources and everything in strategy to prioritize stormwater drainage
between. system improvement projects. Taking Inventory of Current Assets
The city of Germantown, a suburb of Typical for American cities, An inventory of this scale begins
Memphis, saw explosive growth between Germantown’s Capital Improvement Plan with an understanding of the already-
1970 and 2000. The surge in population (CIP) is essential to the municipality’s collected data. The then-current
leveled off around 2000, but the influx of ability to prioritize public projects. stormwater infrastructure data included
people and limited land resulted in the With great forethought, Germantown outdated, scanned record drawings from
need for new types of developments. allocated resources in their current CIP previous construction projects. Without
toward improving the stormwater system. modernized systems, this preliminary
Zero-lot-line and mixed-use buildings, The City understood it was crucial to data collection phase was bound to be an
often called “infill developments,” are strategize, identify and organize flood arduous and expensive process.
designed to accommodate a large number mitigation alternatives.
of people in a small footprint. Infill To bring the City’s systems up to date
developments often replace traditional The budget allocated in the CIP did and facilitate more accurate reporting,
quarter-acre-lot residential subdivisions not allow flood mitigation efforts to be Barge created and configured an ArcGIS
and create more impervious area per completed for the entire City at once. Online Map. This technology utilizes
acre of land in the City, which affects the In order to determine which assets to mobile tablets and phones to collect
absorption of rainwater. prioritize, the City had to take inventory photos, condition assessments, measure
of the current system and identify the downs and field comments, which are all
The large volume of added impervious most immediate concerns. georeferenced.
area increased stress on Germantown’s
aging stormwater infrastructure, because Germantown teamed with Barge Design The process of data collection is
the system was initially designed with Solutions, Inc. to prepare a stormwater streamlined in an app using dropdowns,
much different criteria in mind. This master plan. Barge’s inventory of toggle buttons and check-blocks. All the
added stress can worsen existing trouble Germantown’s systems has helped the City data can be viewed and edited by the City
areas or create flooding in areas which prioritize the numerous projects outlined on a webpage, which enables managers
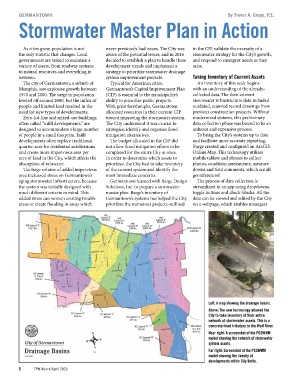
Left: A map showing the drainage basins.
Above: The new technology allowed the
City to take inventory of their entire
network of stormwater assets. This is a
concrete lined tributary to the Wolf River.
Near right: A screenshot of the PCSWMM
model showing the network of stormwater
system assets.
Far right: Screenshot of the PCSWMM
model showing the density of
developments within City limits.
6 TPW March/April 2020